ARIA Sentinel-1 GUNW Product Guide
This document is a guide for users of ARIA Sentinel-1 Geocoded Unwrapped (GUNW) Interferograms.
The ARIA Sentinel-1 Geocoded Unwrapped Interferogram (ARIA-S1-GUNW) product is a standardized interferometric SAR (InSAR) dataset that enables rapid analysis of surface deformation using Sentinel-1 SAR data. Produced by JPL’s ARIA project and hosted at the Alaska Satellite Facility (ASF) DAAC, it provides CF-compliant NetCDF files at 90-m pixel spacing, containing unwrapped interferometric phase measurements, imaging geometry, various correction layers, and metadata. Products are available for VV polarization only.
With over 1.1 million (and growing!) freely available products covering major fault systems, volcanic regions, and coastal zones, ARIA-S1-GUNW products facilitate scientific research and disaster response by simplifying access to centimeter-scale ground displacement measurements. Generated through an open-source, cloud-based ISCE2 TopsApp processing pipeline, these products support applications such as earthquake impact assessment, volcanic monitoring, and long-term land motion studies, with ongoing improvements enhancing their accuracy and usability.
The ARIA project also maintains the ARIA-tools software package, which is a suite of open-source tools that allows users to automate the seamless download, post-processing manipulation, aggregation, and management of ARIA-S1-GUNW products. Refer to the ARIA-tools GitHub page for a more thorough overview and installation instructions, and tutorials led by EarthScope Consortium, which demonstrate practical applications.
This work was funded in part by the Enabling Cloud-Based InSAR Science for an Exploding NASA InSAR Data Archive project under NASA's ACCESS program.
ARIA-S1-GUNW products are not produced globally
ARIA-S1-GUNW products are routinely produced only for specific locations, so the ASF archive may not contain products in your area of interest. See the Ordering On Demand Products section for information on ordering ARIA-S1-GUNW products for specific Sentinel-1 acquisitions.
Archived and On Demand Products
While there is a large archive of ARIA-S1-GUNW products that have already been generated and are ready for download, they may not cover your area of interest. In addition, the archived products may not include the full range of temporal baseline pairings required for your analysis. If you are interested in ARIA-S1-GUNW products that are not already represented in the archive, ASF provides the ability to generate these products using specific Sentinel-1 SLC pairings.
On Demand ARIA-S1-GUNW products are generated using the same code used by the ARIA project, and have been validated to ensure that products generated On Demand and those generated by the ARIA team at JPL are fully interoperable. Products generated On Demand are automatically added to the ARIA-S1-GUNW archive once processing is complete, where they can be found by anyone searching for ARIA-S1-GUNW products.
ARIA Frame IDs
Sentinel-1 IW SLC products are not created in a way that ensures that granules for the same relative orbit and location always fully overlap over time. This results in inconsistent framing of the Sentinel-1 IW SLCs that can make it difficult to create longer series of Sentinel-1 InSAR products.
In the image below, Sentinel-1 footprints acquired over an area of interest are displayed. Over the full period of record of the mission, the SLC framing has shifted considerably, resulting in some acquisitions that hardly overlap at all.

To address this issue, the ARIA team defined a standard set of geographic footprints, called frames, that set the geographic extent for each ARIA-S1-GUNW product. This is possible because while the Sentinel-1 IW SLC products are not consistently framed along the orbit path, the smaller burst SLCs that comprise each Sentinel-1 IW SLC product do have consistent footprints.
Each ARIA frame is defined by the extent of a specific collection of these individual burst SLCs. Each ARIA-S1-GUNW product is processed to the extent of one of these frames, which results in output products with consistent footprints through time. ARIA-S1-GUNW products containing the same bursts, and thus sharing the same geographic footprint, are said to have the same ARIA Frame ID.

Accessing Existing Products
You can download existing ARIA-S1-GUNW products from the Alaska Satellite Facility’s (ASF) Vertex search portal by following these steps:
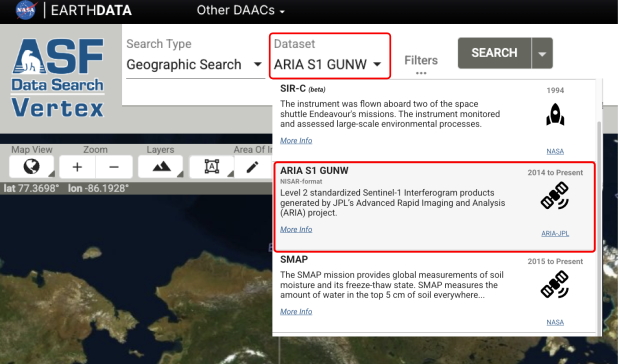
- Access Vertex – Go to the ASF Vertex website: https://search.asf.alaska.edu.
- Search for ARIA-S1-GUNW Products – In the dataset selector, click on ARIA S1 GUNW to filter for these
specific products. You can refine results by specifying a geographic region, date range, or other criteria
using the search filters in the “filters” panel.
- Preview and Select Products – Click on individual results to view metadata, including coverage area and acquisition details.
- Download Data – To download, first add ARIA-S1-GUNW products to your Download Queue using the shopping cart icon next to each product, then download your selected products using the options available in the Download Queue interface.
Search results include both products generated by the ARIA team and products generated by users submitting ARIA-S1-GUNW jobs for On Demand processing.
Ordering On Demand Products
If the ARIA-S1-GUNW products you need are not available in the archive, you can use ASF's On Demand platform to submit custom ARIA-S1-GUNW jobs for processing.
Sentinel-1D acquisitions not yet supported
ISCE2 software, which is used for processing ARIA GUNW products, does not currently support processing SLCs acquired by the newly launched Sentinel-1D platform. Until the software package is updated, users will not be able to submit ARIA-S1-GUNW jobs that include Sentinel-1D acquisitions for On-Demand processing.
To order ARIA-S1-GUNW products using Vertex, select ARIA-S1-GUNW from the Dataset menu for a Geographic Search, and turn on the On Demand toggle switch.

This displays an ARIA Frame ID map, which serves as the interface for selecting input scenes to submit for processing.
ARIA Frame ID Maps
As described in the ARIA Frame IDs section, ARIA-S1-GUNW products are processed based on frames that are consistent through time. There is a different set of ARIA Frame IDs for each orbit direction (Ascending and Descending).
Flight Direction
By default, Vertex displays frames for the Ascending orbit direction. To view the frames for the Descending orbit direction, click the Filters button and set the Flight Direction option to the desired direction.

ARIA Frame ID GeoJSON
The ARIA project provides a geojson file indicating the extent of each ARIA Frame ID, which can be downloaded and used for reference outside of Vertex. When the On Demand toggle is activated, a download link for this geojson is displayed next to the toggle switch.
Processing Parameters
While the ARIA processing code takes a list of reference and secondary Sentinel-1 IW SLC granules as input, On Demand users do not need to assemble these lists manually.
To ensure full coverage over the desired ARIA Frame and avoid failures caused by incomplete granule lists, the ARIA-S1-GUNW On Demand job specification simply takes the ARIA Frame ID and the dates of the desired primary and secondary passes over that frame.
Search for ARIA-S1-GUNW Date Pairs
Vertex provides a good interface for finding suitable primary and secondary acquisition dates for a specific ARIA Frame ID.
-
Perform a Vertex Geographic Search for the ARIA S1 GUNW Dataset and activate the On Demand toggle switch to view the ARIA frames.
- Recall that there are different frame maps available for Ascending and Descending orbit directions. Verify that you have selected the desired orbit direction.
- To select a different direction, click on the Filters button and use the Direction filter in the Additional Filters section to select Ascending or Descending.

-
Click on the desired frame and click Build SBAS SLC Stack to find available date pairings for that frame. This opens the SBAS Tool with the necessary parameters already set to support ARIA-S1-GUNW jobs:
- The tool opens in Frame Mode
- The Dataset is set to ARIA-S1-GUNW
- The Frame field is populated with the selected ARIA Frame ID

- Only date pairs that have the required 90% minimum coverage of the selected ARIA Frame are included in the results.
ARIA-S1-GUNW Jobs Require SBAS Frame Mode
If ARIA-S1-GUNW jobs are submitted from the SBAS interface without Frame Mode turned on, the jobs will fail.
To avoid potential errors when submitting ARIA-S1-GUNW jobs, it is best to use the ARIA-S1-GUNW Geographic Search interface to launch the SBAS tool, which automatically provides the correct settings to support ARIA-S1-GUNW SBAS stacks.
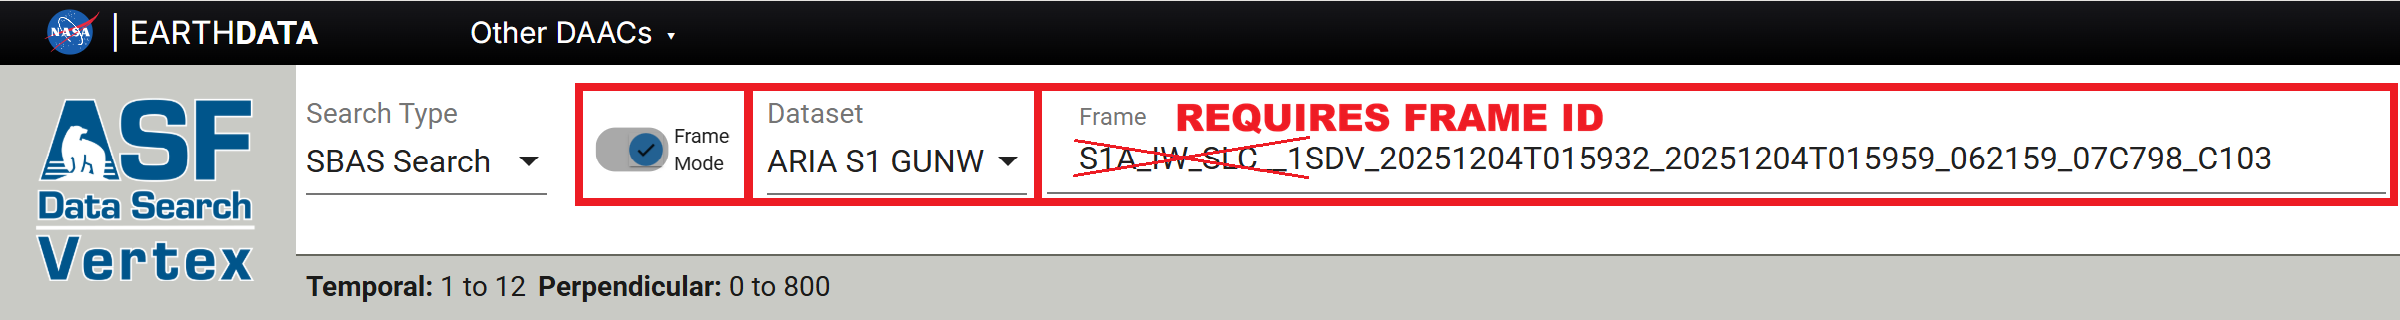
If you do access the SBAS tool using a Sentinel-1 Geographic Search, you will need to activate the Frame Mode toggle AND enter a valid ARIA Frame ID instead of a Sentinel-1 Scene name before you can submit ARIA-S1-GUNW jobs for On Demand processing.
-
Adjust the SBAS parameters to refine the date pairs displayed in the list of results.
- Click the SBAS Filters button to set or adjust the date range for the listed pairs
- Use the vertical slider to restrict the results based on perpendicular baseline values (distance between the sensor location for the two acquisition dates)
- Use the horizontal slider to refine temporal baseline values (the number of days between the two acquisition dates) included in the results

- Click on the On Demand icon for a desired date pair, click the ARIA_S1_GUNW job type, and click Add 1 SLC Pair to add it to the On Demand Queue.


- To add all of the date pairs listed in the results to the On Demand Queue, click the On Demand button at the top of the results list. Click on the ARIA_S1_GUNW job type, then select the option to add all of the SLC pairs to the On Demand Queue.
Submit On Demand ARIA-S1-GUNW Jobs
On Demand ARIA-S1-GUNW jobs can be submitted for processing using the On Demand Queue in Vertex or programmatically.
Unlike ASF's other On Demand InSAR workflows, customizable processing options (multilooking, filter strength, etc.) are not available for ARIA-S1-GUNW jobs.
Submit Jobs in Vertex
Once you have added the desired jobs to your On Demand Queue in Vertex, click the large On Demand icon in the top right corner of Vertex and select On Demand Queue to view your On Demand Queue and submit your processing request.

Review the list of jobs in the ARIA_S1_GUNW tab of the queue, then click the Submit Jobs button at the bottom of the window. You will have the option to enter a Project Name before completing the submission.
ARIA-S1-GUNW Jobs Require Frame ID
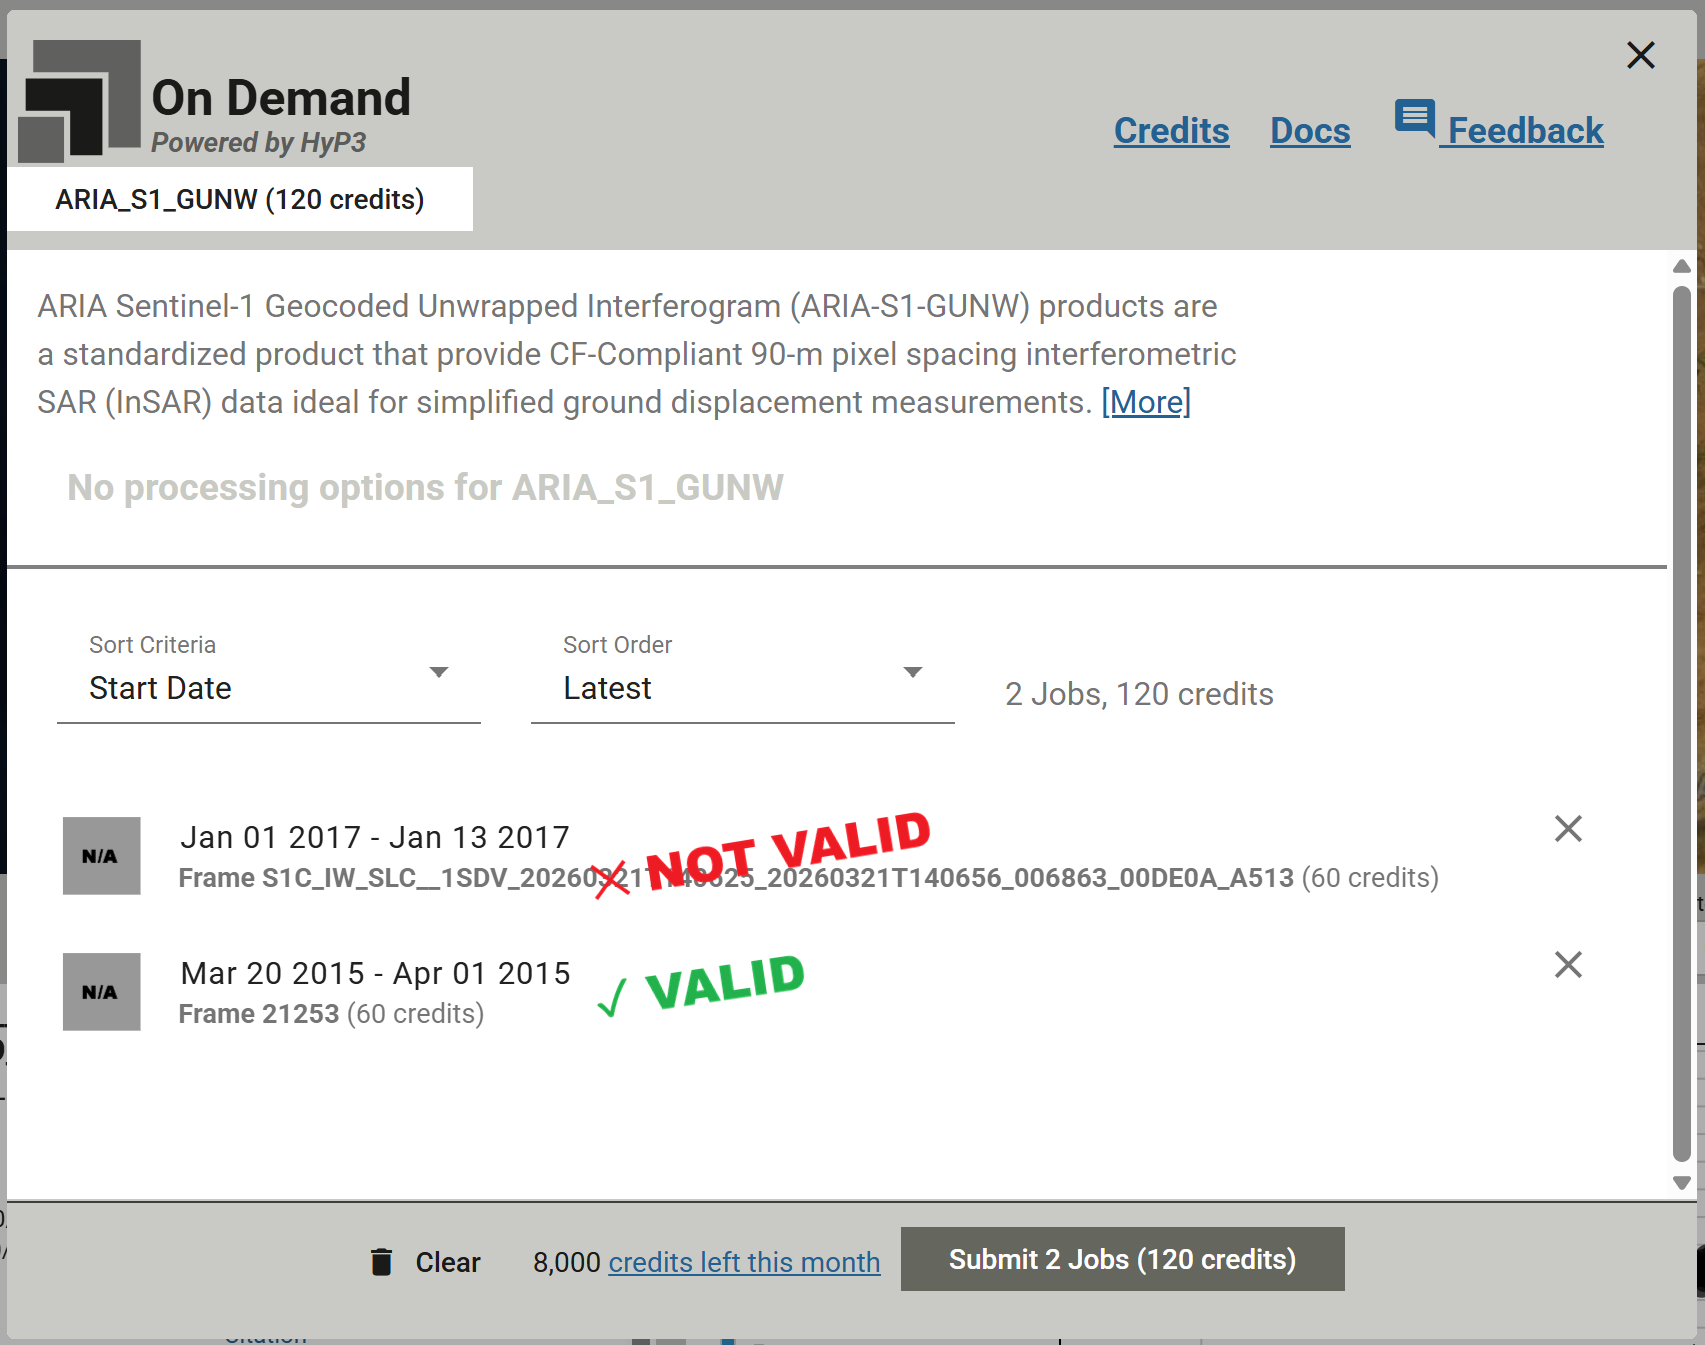
ARIA-S1-GUNW jobs require a valid ARIA Frame ID when they are submitted for On Demand processing in Vertex.
If a Sentinel-1 SLC Scene is referenced for a job listed in the ARIA-S1-GUNW tab of the On Demand Queue in Vertex, processing will fail. These jobs must reference an ARIA Frame ID rather than a Sentinel-1 Scene.
Submit Jobs Programmatically
There are two options for submitting jobs programmatically:
- Use the
ARIA_S1_GUNWjob type in the HyP3 API - Use the
submit_aria_s1_gunw_jobmethod of theHyP3class in the HyP3 Python SDK
To submit an ARIA-S1-GUNW job using either of these programmatic approaches, the necessary parameters are:
- the ARIA Frame ID number
- the reference date, which is the more recent pass over the ARIA Frame
- the secondary date, which is the earlier pass over the ARIA Frame
The dates must be in YYYY-MM-DD format.
Reference and Secondary Dates
ARIA-S1-GUNW products use the SLCs from the more recent pass as reference, while secondary scenes are from the earlier pass in the date pair. When submitting jobs in Vertex, the reference and secondary dates are automatically ordered for you based on the date pairs selected from the frame-based SBAS search results.
When submitting a job using the HyP3 API or SDK, the date passed as the reference date must be more recent than the secondary date. If they are in the opposite order, an error will be raised.
Note that this is the opposite order than what is used for all other On Demand InSAR products available from ASF. Both the InSAR GAMMA products and the Burst InSAR products use the earlier acquisition as reference, and the more recent acquisition as secondary.
This means that the ARIA unwrapped interferograms have the opposite sign from the unwrapped interferograms generated by the other ASF On Demand InSAR workflows. In the ARIA-S1-GUNW products, negative phase differences indicate movement away from the sensor and positive phase differences indicate movement towards the sensor.
Product Packaging
Naming convention
The ARIA-S1-GUNW product names contain detailed information about the acquisitions and processing workflows used to generate them, including:
- Satellite orientation. A for ascending or D for descending
- Satellite look direction. L for left-looking or R for right-looking
- Satellite track number (3-digit number)
- Reference and secondary acquisition dates (YYYYMMDD)
- Center time of reference scene(s) in UTC (HHMMSS)
- Longitude and latitude in whole degrees
- Unique product hash
- Standard product version
This results in a filename constructed as illustrated in the figure below:

Product Elements
The product is packaged as a NetCDF4 file, with its top-level group named science. Within the science group,
there is a grids group, which is further divided into three subgroups: data, imagingGeometry, and corrections.
- The
datagroup contains 2D datasets at a resolution of 3 arc-seconds (~90 m). - The
imagingGeometrygroup includes 3D datasets posted laterally at 0.1-degree intervals (~11 km). - The
correctionsgroup provides ionospheric and solid Earth corrections, and if a weather model is available, the corresponding tropospheric correction layer (HRRR/reference/troposphereWet) will be included here.
All 2D and 3D datasets are in the EPSG:4326 projection.
The output netCDF file will include the layers listed in the table below.
| Group | Dataset Name | Description | Units |
|---|---|---|---|
| data | amplitude | 2D Amplitude of IFG | watt |
| coherence | 2D Coherence [0-1] from filtered IFG | unitless | |
| connectedComponents | 2D Connected component file | unitless | |
| unfilteredCoherence | 2D Coherence [0-1] from unfiltered IFG | unitless | |
| unwrappedPhase | 2D Filtered unwrapped IFG geocoded | rad | |
| corrections | ionosphere | 2D Split spectrum ionospheric delay correction | rad |
| ionosphereBurstRamps | 2D Split spectrum ionospheric burst ramp correction | rad | |
| reference/solidEarthTide | 3D solid earth tide for reference granule | rad | |
| secondary/solidEarthTide | 3D solid earth tide for secondary granule | rad | |
| HRRR/reference/troposphereWet | 3D wet troposphere for reference granule | rad | |
| HRRR/secondary/troposphereWet | 3D wet troposphere for secondary granule | rad | |
| HRRR/reference/troposphereHydrostatic | 3D hydrostatic troposphere for reference granule | rad | |
| HRRR/secondary/troposphereHydrostatic | 3D hydrostatic troposphere for secondary granule | rad | |
| imagingGeometry | azimuthAngle | 3D azimuth angle grid | degree |
| incidenceAngle | 3D Incidence angle grid | degree | |
| lookAngle | 3D look angle grid | degree | |
| parallelBaseline | 3D parallel baseline grid | meter | |
| perpendicularBaseline | 3D perpendicular baseline grid | meter |
Ionospheric Correction Layer
Although the ionospheric effects for C-band SAR are only about one-sixteenth of those at L-band, the measurement accuracy of Sentinel-1 C-band SAR data can still be degraded by long-wavelength ionospheric signals. Utilizing the range-split spectrum methodology available within ISCE2, ARIA-S1-GUNW products include an ionospheric correction layer packaged as a differential field between the secondary and reference input data. Since these layers have smooth variation in space they are downsampled to 33 arc-seconds (~1 km), and thus have to be interpolated before being subtracted from the unwrappedPhase field, which is sampled at 3 arc-seconds (~90 m).
Solid Earth Tides Correction Layers
Solid Earth tides (SET) are periodic deformations of the Earth's crust caused by gravitational forces from the Moon and Sun, resulting in surface displacements of up to several centimeters. Correcting for SET in InSAR is crucial to prevent these predictable, cyclic motions from being misinterpreted as real ground deformation. ARIA-S1-GUNW products include SET correction layers, created using the PySolid python package, for both the reference and secondary input data. These layers are packaged within the products as 3D datasets posted laterally at 0.1-degree intervals (~11 km) and vertically at the following height intervals: -1.5 km, 0 km, 3 km, 9 km.
Tropospheric Delay Correction Layers
Tropospheric delay correction is essential for many InSAR applications because atmospheric variations in temperature, pressure, and humidity can distort phase measurements, mimicking ground deformation and reducing accuracy. ARIA-S1-GUNW products for both the continental U.S. and Alaska also contain a tropospheric delay correction layer that is produced via the Raytracing Atmospheric Delay Estimation for RADAR (RAiDER) Python package.
RAiDER uses the NOAA High-Resolution Rapid Refresh weather model to calculate the tropospheric delay correction at a spatial resolution of approximately 3 km. If the HRRR weather model is not available for a location of interest, (i.e. outside of the continental U.S. and Alaska) the tropospheric delay correction layer will not be included in the ARIA-S1-GUNW product. The wet and hydrostatic tropospheric delay correction are provided for both the reference and secondary input data. These layers are packaged within the products as 3D datasets posted laterally at 0.05-degree intervals (~5.5 km) and vertically in 0.5 km increments between -0.5 km and 9 km.
Data Access
ARIA-S1-GUNW On Demand products can be accessed like any other On Demand product, but can also be accessed by searching the archive.
Accessing Products using On Demand Interfaces
Refer to the Downloads page for more information on viewing and downloading ARIA-S1-GUNW On Demand products in Vertex or programmatically. Once processing is complete, download links for On Demand products are valid for 14 days.
Accessing Products in the Archive
Once On Demand ARIA-S1-GUNW jobs have been processed, they are added to the archive of ARIA-S1-GUNW products. Use the Geographic Search in Vertex to find all of the products (both those generated by the ARIA project and those generated On Demand) available for your area of interest. The download links for archived ARIA-S1-GUNW products never expire.
You can also search for ARIA-S1-GUNW products programmatically using the asf_search Python Package. Again, results will include products generated by the ARIA team along with any On Demand ARIA-S1-GUNW products that have completed processing.
Accessing and Leveraging Product Layers with ARIA-tools
The ARIA-tools Python package supports automated workflows for accessing, subsetting, interpolating, and correcting ARIA-S1-GUNW layers.
Refer to the Downloading GUNW products using ariaDownload.py Jupyter Notebook to learn how to use ARIA-tools to search for and download ARIA-S1-GUNW products from ASF's archive.
The Manipulating Layers of ARIA standard GUNW products Jupyter Notebook demonstrates using ARIA-tools to extract and subset ARIA-S1-GUNW layers, and presents workflows for applying the included correction layers and generating displacement maps.
References
Bekaert, David, et al. "The ARIA-S1-GUNW: The ARIA Sentinel-1 Geocoded Unwrapped Phase Product for Open InSAR Science and Disaster Response." IGARSS 2023-2023 IEEE International Geoscience and Remote Sensing Symposium. IEEE (2023).
Buzzanga, Brett, et al. "Toward sustained monitoring of subsidence at the coast using InSAR and GPS: An application in Hampton Roads, Virginia." Geophysical Research Letters 47.18 (2020): e2020GL090013.
Liang, Cunren, et al. "Ionospheric correction of InSAR time series analysis of C-band Sentinel-1 TOPS data." IEEE Transactions on Geoscience and Remote Sensing 57.9 (2019): 6755-6773.
Yunjun, Zhang, et al. "Range geolocation accuracy of C-/L-band SAR and its implications for operational stack coregistration." IEEE Transactions on Geoscience and Remote Sensing 60 (2022): 1-19.